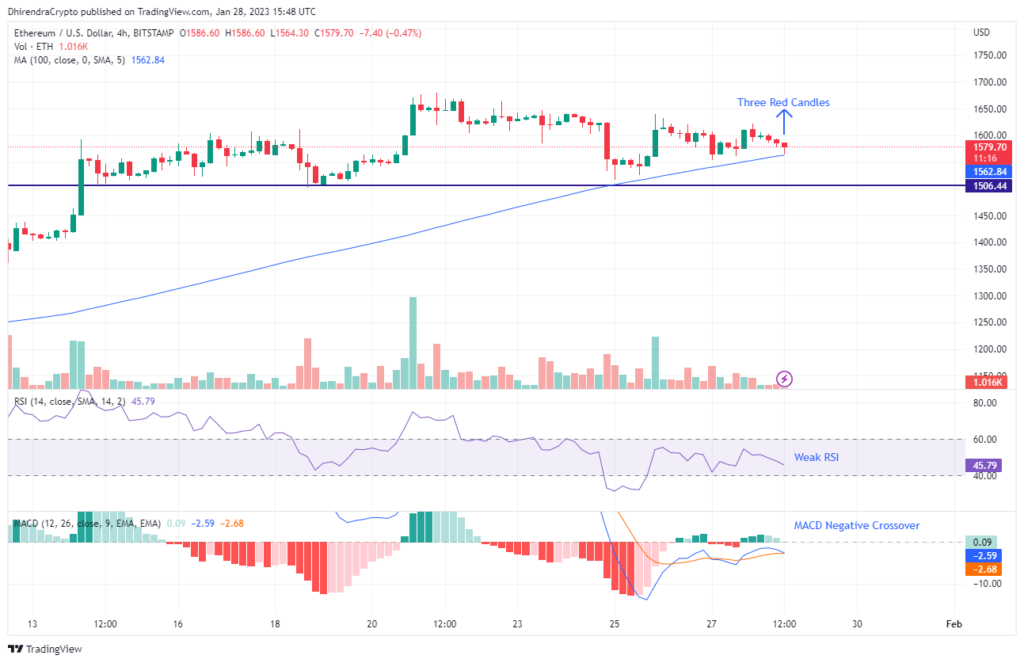
Ethereum Price Analysis on 4-Hour Charts is showing a very weak chart pattern. The prices could drop down to $1506 if chart pattern materializes. The chart is clearly showing downward growth in the near future(1 week).
Ethereum and Bitcoin have been in heavy accumulation mode for past few months. Now that prices have rise, about 41% in one month, some profit booking is expected.

Ethereum 4-Hour Charts has shown multiple factors that might bring down Ethereum prices to $1506 from currently $1580.
- The 4 Hour chart shows Three Black Crows chart pattern which indicates upcoming downtrend.
- The price is about to cross the 100 period Moving Average of 4-Hour period towards downside.
- RSI is getting weaker and is decreasing.
- MACD shows that a negative crossover is imminent signaling a downtrend.
Targets and Stoploss
For the above setup, it is advisable to short Ethereum with a leveraged trade. Leverage trade gives multiple returns on the same capital but are also risky. New traders are advised to not use leverage beyond 5x.
Target(SHORT): $1506
Time Period: 1 Week
Stoploss: $1599
Also Read: AI Token that became 10x in one month.


