

There is a huge trading opportunity in Cosmos(ATOM) as it crosses 200DMA with RSI above 60 and a positive MACD Crossover.
Disclaimer: I have myself bought the ATOM seeing such a chart structure.
What is Cosmos?
Cosmos is called the internet of blockchains. It is a network of blockchains that are designed to scale and interoperate with each other.
For more details, please visit the official website.
What is ATOM?
ATOM is the native cryptocurrency of the Cosmos Hub. Users of the network use ATOM to pay for gas, earn rewards, and stake it to become validators. Further, the ATOM is also a governance token of the Cosmos Network’s ecosystem.
Breakouts in Multiple Charts
Cosmos Hub’s token ATOM has shown a breakout in multiple timeframes with multiple indicators showing a breakout.
Full Chart Here at TradingView.
https://in.tradingview.com/chart/ATOMUSDT/cbONMMNf-200-DMA-Breakout/
Daily Charts

On Daily Charts, the scrip shows an RSI above 60 even in a bear market on a day when all other cryptocurrencies are down by at least a percentage.
The MACD line is also above the signal line, which confirms our bullish position.
The ATOM Price has breached the 200 Daily Moving Average of 15.65 decisively.
4 Hour Charts
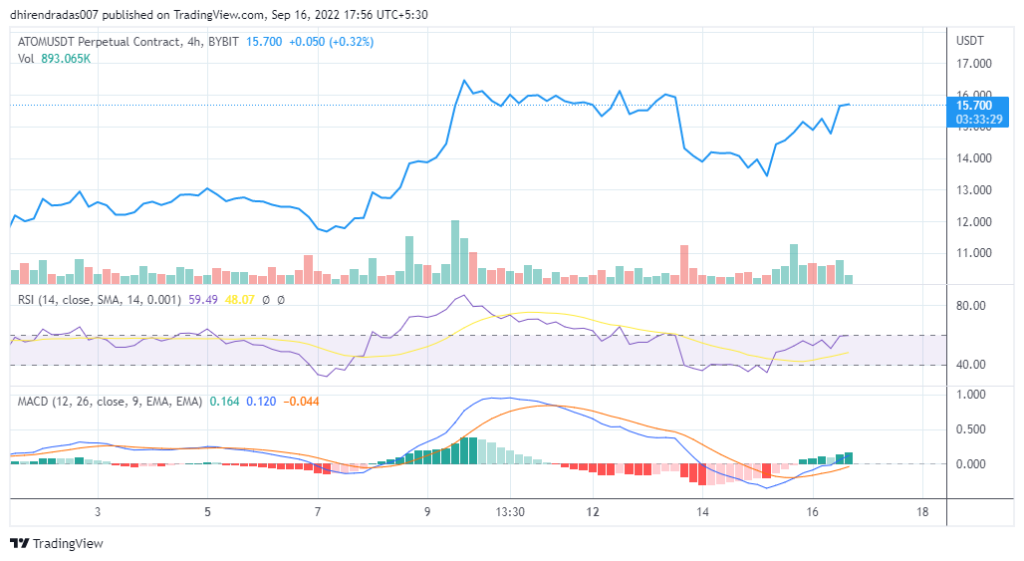
On the 4 Hour timeframe, RSI is very close to 60, which is a green signal in a bear market.
The MACD line(blue) is above the Trend Line(orange), confirming our buying decision.
The ATOM price is trading above the 200 periods (4 hours here at $12.6) Moving Average.
ATOM Price Prediction
For the current price analysis, we will focus on the daily chart, which neglects the effect of sudden price volatility.

Target:
There is a hurdle expected near the range of $16.2-$16.5. This will be our first target. Our second target is $20.47, which is a minor hurdle. Our ultimate target is $32, which is a major resistance level.
Therefore to summarize, our targets, along with their time periods, are:
- $16.2 (within 1-2 days)- Target Achieved
- $16.5 (within 1-2 days)
- $20.47 (within this week)
- $32 (by the end of 2022)
- Immediate Stop loss: $14. After that, trail your stop loss to your cost and book partial profits at each stage.
Please keep in mind that stop loss is essential in the trade as it helps you survive price crashes and come back another day to trade.
Check out ETH Classic Price Prediction.
I am a certified Research Analyst in Equities. My analysis is purely for educational purposes. Cryptocurrencies are volatile and involve significant risk. Kindly trade at your own risk and with the advice of a financial expert.


[…] our Cosmos Price Prediction resulted in a 6.3% […]