
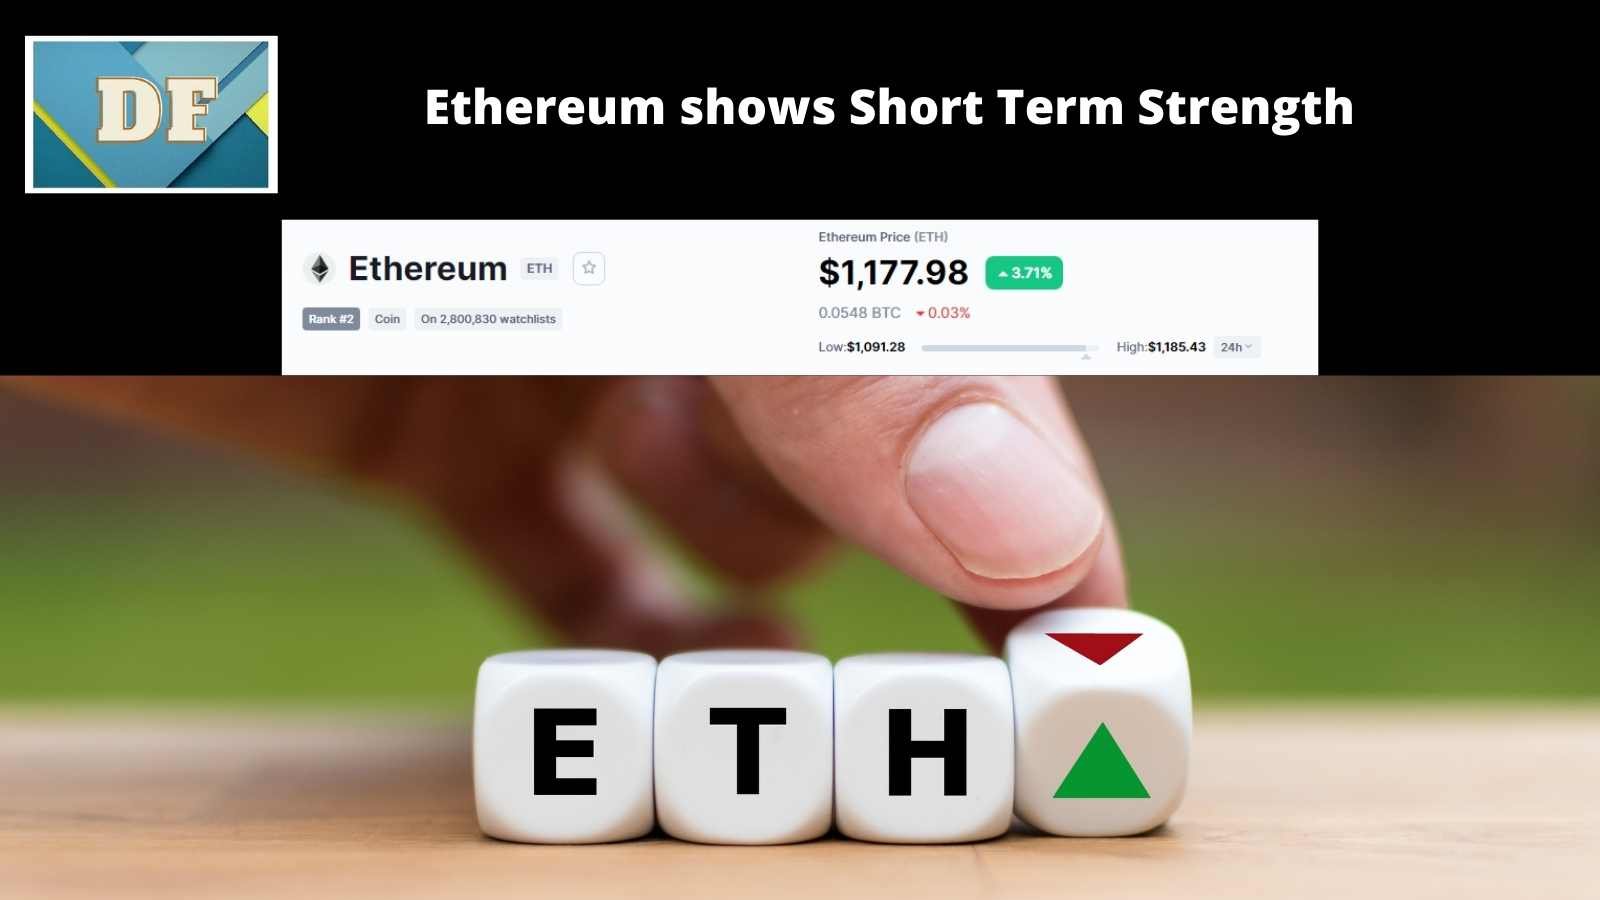
Recently, I published the Bitcoin Technical Analysis. Though we got a signal of buy in the hourly charts, we concluded to wait for the daily charts to get favourable given the market bearishness. Today I brought you the Ethereum Fundamental and Technical Analysis for this month, based on RSI.
Fundamental
Though it is difficult to analyze cryptocurrencies on a Fundamental scale, we analyze Ethereum because, unlike Bitcoin, it provides close support to a host of cryptocurrency tokens, DeFi and lending pools and a majority of NFTs being traded in the market.
Dependence on Ethereum
Defi is a collective term used to denote the open and global financial system which can act as a better alternative for traditional finance. Defi and Blockchain technology is heavily dependent on Ethereum Blockchain due to several factors. A few most important of them are listed below:
- Ether, the native cryptocurrency acts as collateral in many liquidity pools. You can take a loan or lend someone to gain high yield rates. All major DeFi platforms like MakerDAO, Compound Finance, dydx, Dharma, etc readily accept Ethereum as collateral and provide loans to you in the coin/token of your choice.
- A lot of tokens in the market are based on the ERC-20 standard.
- Millions of transactions happen daily on the Ethereum Blockchain. It is trusted, secured and truly decentralized. The following graph shows this data.

- A lot of Dapps run on the Ethereum network.
- The majority of NFTs(60%) are minted and traded on the Ethereum Blockchain. Popular NFTs like Bored Ape, Crypto Kitties, and CryptoPunks are on the Ethereum network.
- With the upcoming merger in the Proof of Work(ETH Mainnet) and Proof of Stake(Beacon Chain) named The Merge in Ethereum Blockchain, it is expected to cross 100,000 transactions per second(TPS) from a current capacity of 10-15 TPS
Technical
Ethereum Hourly Price Charts
- RSI score is above 60.
- RSI score reversed from 40, the upper limit of RSI in a bear market.
- Price rise with a Strong Volume on 19 June.
The prices are expected to rise in short term.

Ethereum Daily Price Charts
On the daily charts, we can see that the
- Prices have reversed from their 52-week low of $880.
- RSI score has bounced back from rock bottom of 20.
- Along with bounceback in the hourly charts, this is surely a sign of reversal, at least in the short-term view (fortnight).

I am a certified Research Analyst in Equities. My analysis is purely for educational purposes. Cryptocurrencies are volatile and involve significant risk. Kindly trade at your own risk and with the advice of a financial expert.


I’m often to blogging and i really appreciate your content. The article has actually peaks my interest. I’m going to bookmark your web site and maintain checking for brand spanking new information.
Pretty! This has been a really wonderful post. Many thanks for providing these details.
There is definately a lot to find out about this subject. I like all the points you made
very informative articles or reviews at this time.
There is definately a lot to find out about this subject. I like all the points you made
I am truly thankful to the owner of this web site who has shared this fantastic piece of writing at at this place.