
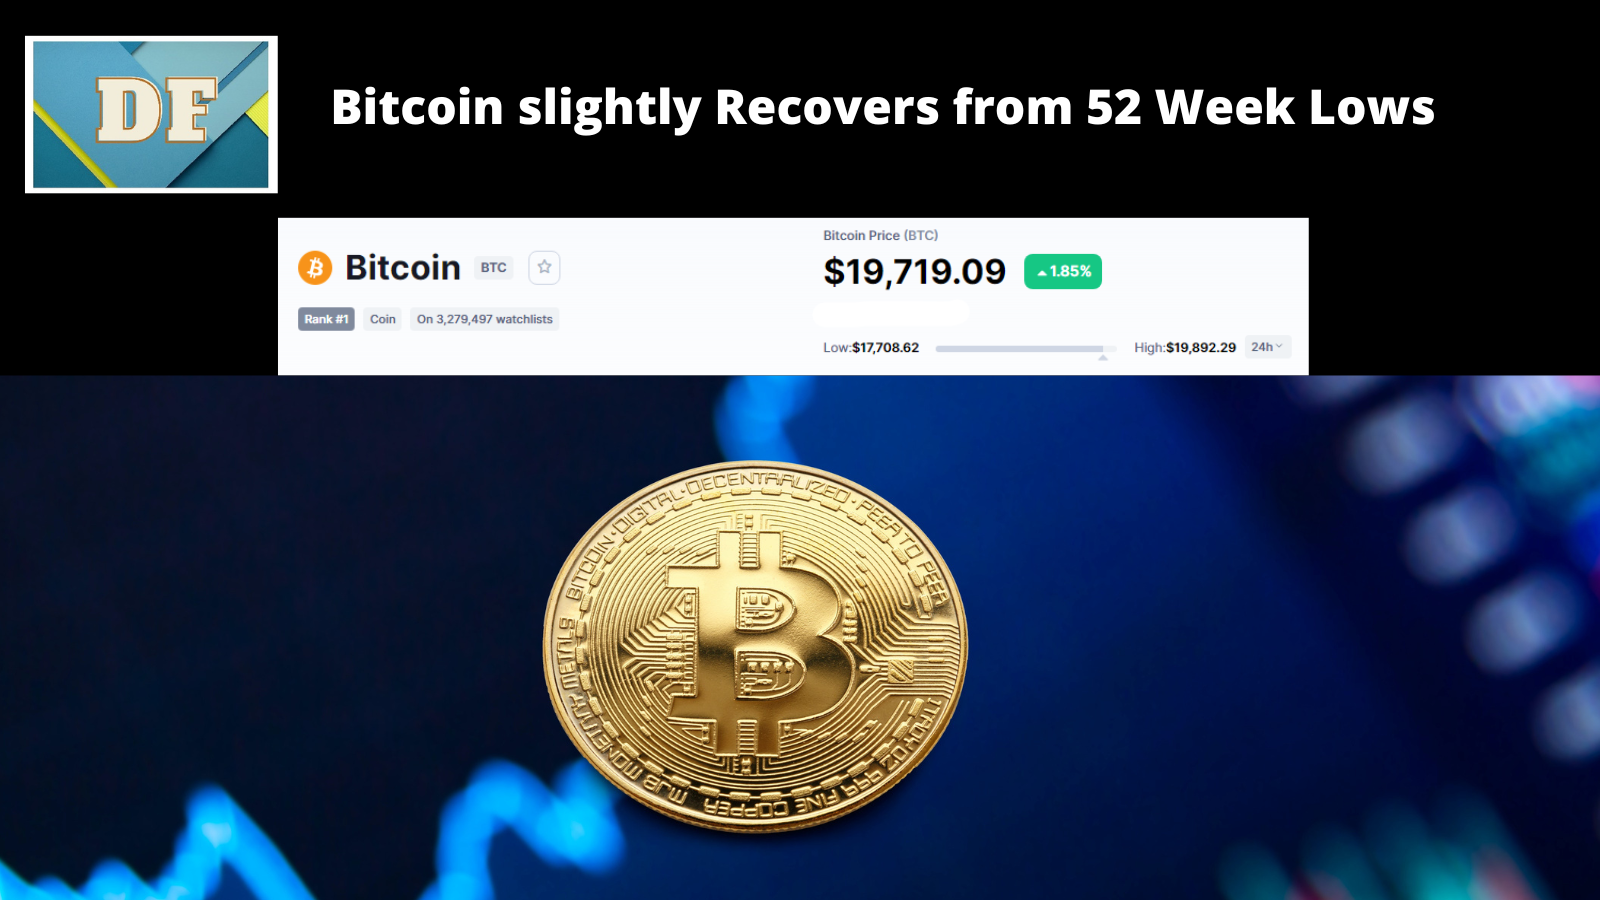
Recently Bitcoin broke the $20,000 market support and faced a sharp decline. After making a 52-week low of $17,708, it recovered more than 10% to $19,700. Here are the fundamental, technical, and on-chain analyses of Bitcoin.

General Analysis of Bitcoin
Bitcoin severely crashed from its all-time high of $68,789, plummeting to $17,708, a crash of nearly 75%. Its market cap dwindled to just $370 Billion from over $1.2 trillion. This was a huge fall even if we consider the volatile nature of cryptocurrencies.

Technical Analysis
Hourly Charts
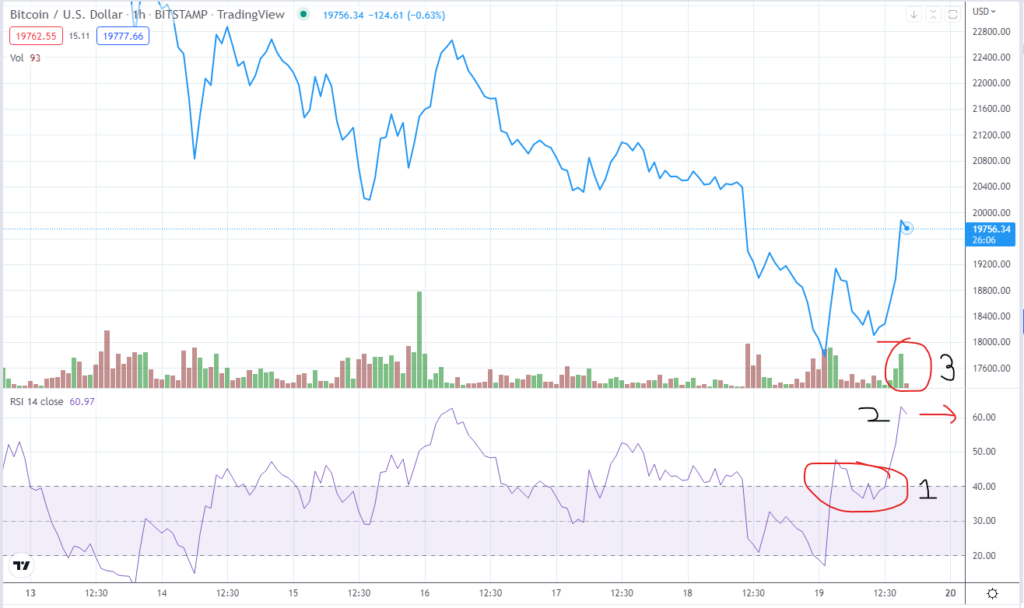
The Technical analysis is based on RSI(relative Strength Index). If we take a look at the hourly charts, it shows a pretty interesting story.
- The RSI score is above 60(#2 in the image) in a bear market which denotes very high bullishness.
- It is a common practice that during bearish markets, the RSI oscillates between the ranges of 40-20.
- We can clearly see that RSI strength bounced back from the levels of 40 twice(#1).
- Also, the price broke out with a high volume than usual signalling that price action is with volume(#3).
Daily Charts
The Story is a bit less optimistic on daily charts.
- The RSI score has bounced back from the level of 20 as shown by #1 in the image.
- The volume is still lesser than its previous days. For this upside move to sustain, the volume needs to be even higher.
- To make any move on either buy or sell direction, I will wait for a bigger volume.

Verdict
The charts seem good on an hourly basis but for investors, they should become good on a daily chart. Since daily charts are much more stable, an RSI above 40 on a daily chart on a sustained basis would mean a beginning of a reversal of bear markets.
Conclusion
The breakout might lure you to buy. However, we suggest that you should not let this breakout tempt you or instil a fear of missing out. You should let the RSI cross 40 in a daily chart before considering any buy decision.
Disclaimer: I am not a registered financial advisor. Though I am a certified Equity and Derivatives Analyst, I do not have a practice license. This blog is purely for educational practices.


[…] I published the Bitcoin Technical Analysis. Though we got a signal of buy in the hourly charts, we concluded to wait for the daily charts to […]