Solana has dropped more than 67% in the last one month. It fell from $38.55 on November 5 and stopped at $11 yesterday. Since then, it has recovered about 18%. But has the fall stopped?
Let us analyze Solana from multiple perspectives to get a comprehensive view:
- Fundamental Analysis
- On-Chain
- Technical Analysis
Fundamentals
Solana collapsed after FTX declared it was facing a liquidity crisis along with sister firm Alameda Research. Together FTX and Alameda held $SOL tokens worth more than $1.275 Billion as additional locked tokens. They received these tokens as early investors and backers of the project and were scheduled to unstake by Epoch 370.
Further, the unstake epoch of 370 has ended, but many players seem not to sell due to low market prices. But anyways they will sell in the near future which adds to further uncertainty.
There was a possibility that prices would crash if FTX and Alameda began selling $SOL tokens. This led to a price crash, bringing $SOL prices to $11.
On Chain Analysis
On-Chain analysis shows that Solana had some rough beginnings in the past. Since the last 6 months, there has been a loss of confidence in the blockchain by several users on a broad scale. Comparing Solana with others, the same amount or similar loss is not visible in the Ethereum blockchain’s on-chain data.
Data is taken from The Block.
Also Read: On-Chain data shows Record Ethereum Ownership? Will Bitcoin follow suit?
New Addresses per month at 6-Month Low
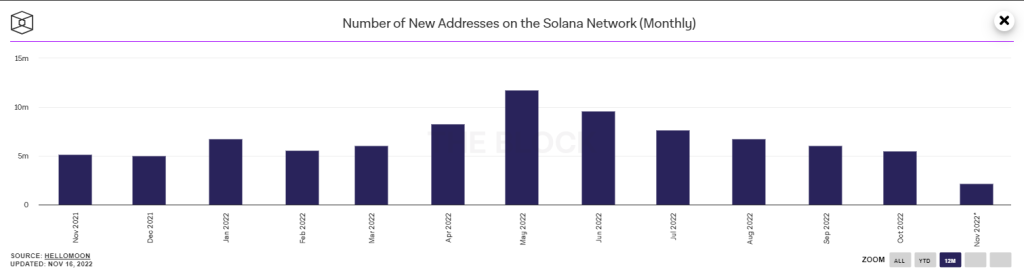
Solana Blockchain added 11.72 Million new addresses in May, whereas in October, it added just 5.52 Million active addresses. For the same period, Ethereum added additional 2.79 Million addresses in October and around 2.5 Million new addresses in May.
Active Addresses at 6-Month Low
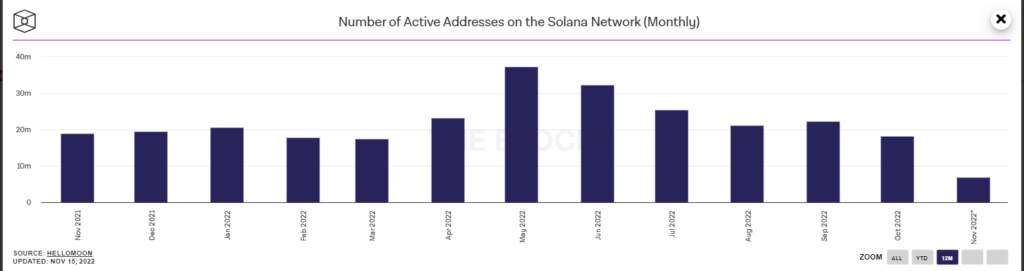
Solana had some 37 Million active addresses in May, dropping to about 18 Million in October, a 50% loss. Ethereum lost only 8% of active addresses comparing May with October.
Technical Analysis

Overall chart structure appears to be recovering from being oversold. The prices are expected to move forward slowly. There is support on daily charts at $11.80 and resistance at $14.55 and $18. It is suggested to keep a stop loss of $11.80 to save capital if the market worsens.
Technical parameters like the RSI are rising from the oversold territory. This indicates a positive and growing momentum.
Further, MACD indicates a positive moving average crossover.
Overall the prices seem to recover but not by a large margin. The recovery will be a pullback where SOL prices can go as high as $20. After that overall market conditions will take over and influence SOL prices.
Also Read: On-Chain Bitcoin Analysis indicates a further fall in prices.
Conclusion
Fundamental and on-chain analysis shows that the future might be weak for SOL in the near term. There is an upcoming dump by big players, even if the unlock has been postponed. However, Technical analysis shows a brief pullback. It is best advised to stay away from Solana and only start when the overall market conditions improve.
Disclaimer: This is educational content and is not to be taken as financial advice.